
Your Criteo dashboard provides live data and analytics about your business performance and potential.
In this article:
Here's how to track and manage performance on Criteo:
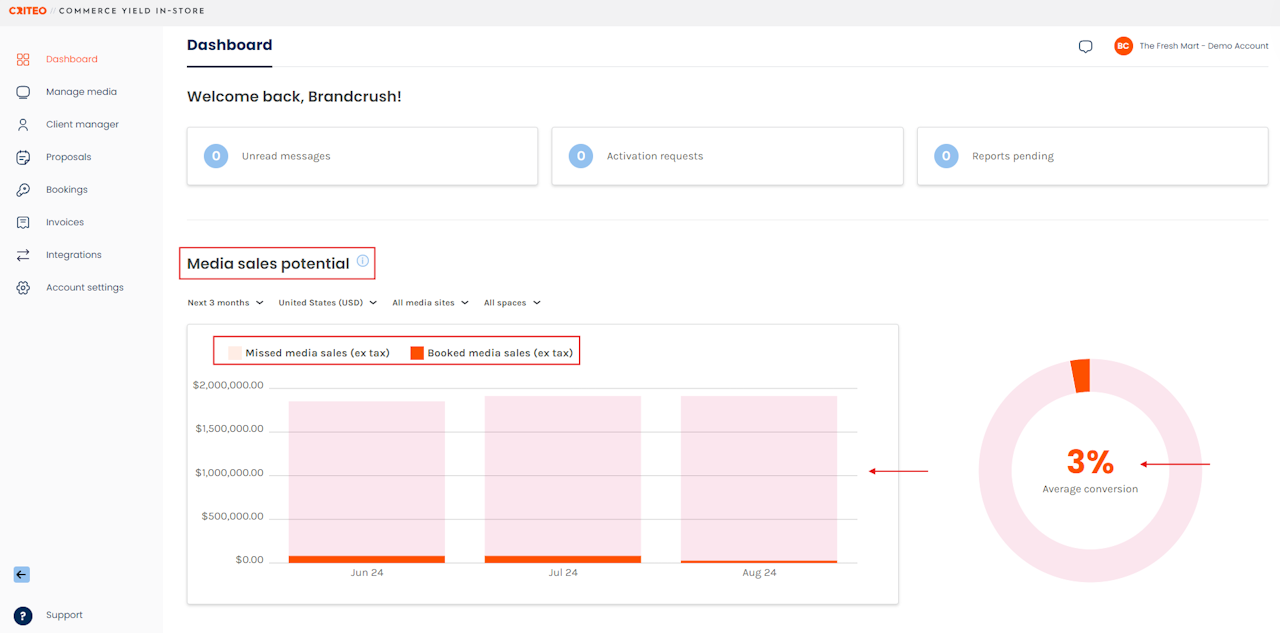
Your Media sales potential outlines your Booked media sales against your Missed media sales based on available inventory, formulating your Average conversion rate.

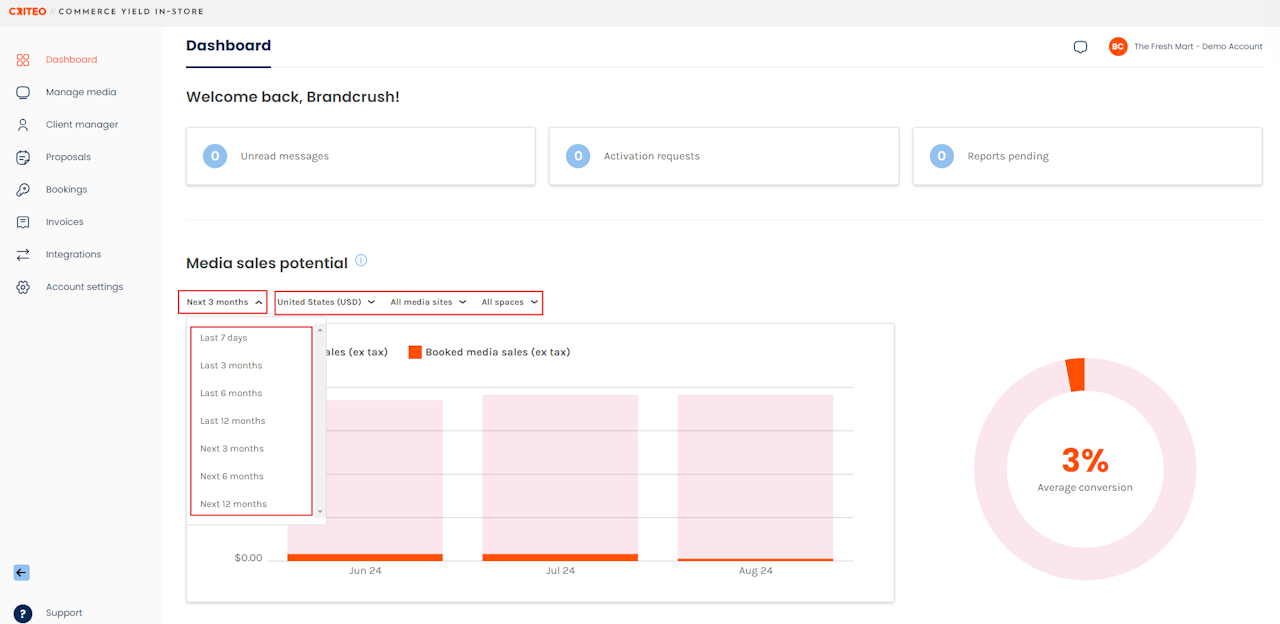
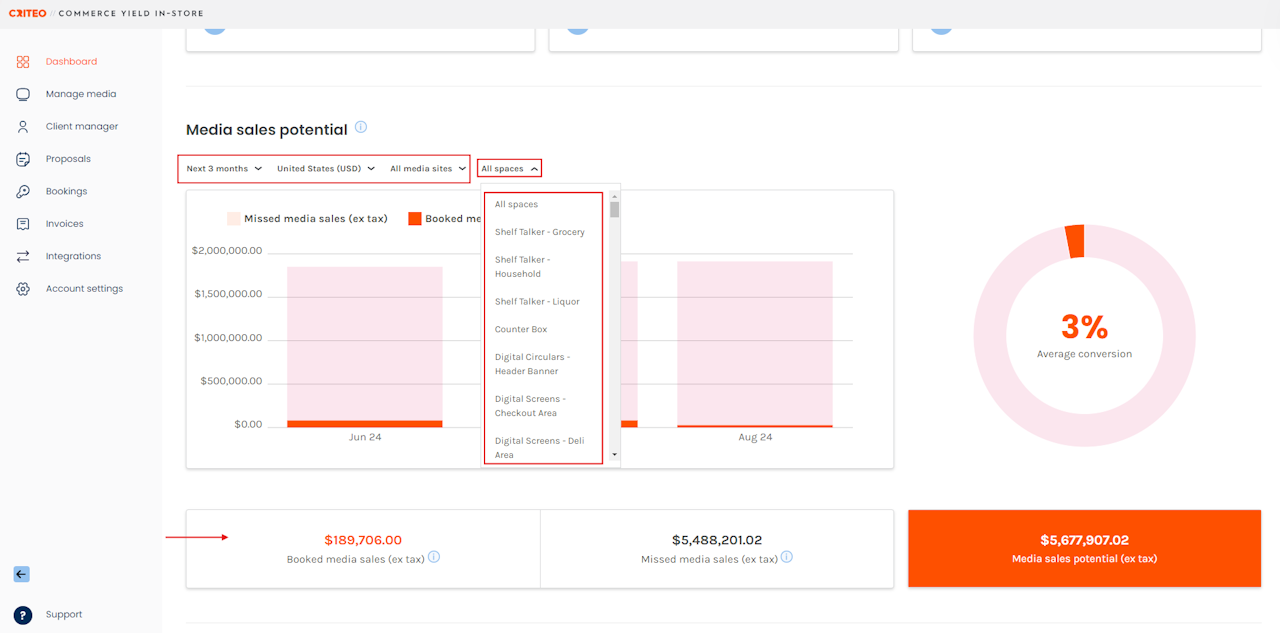
- Filter your Media sales potential by timeframe, location, Media site and space using the corresponding filters.
- Media sales potential is defined as the total sales potential in a selected period and is calculated based on your activation rates and total space availability, excluding tax.

- The Booked media sales and Missed media sales figures update as different filtering parameters are selected.
- Booked media sales is the total media sales from all accepted bookings.
- Missed media sales is the media potential less booked revenue.

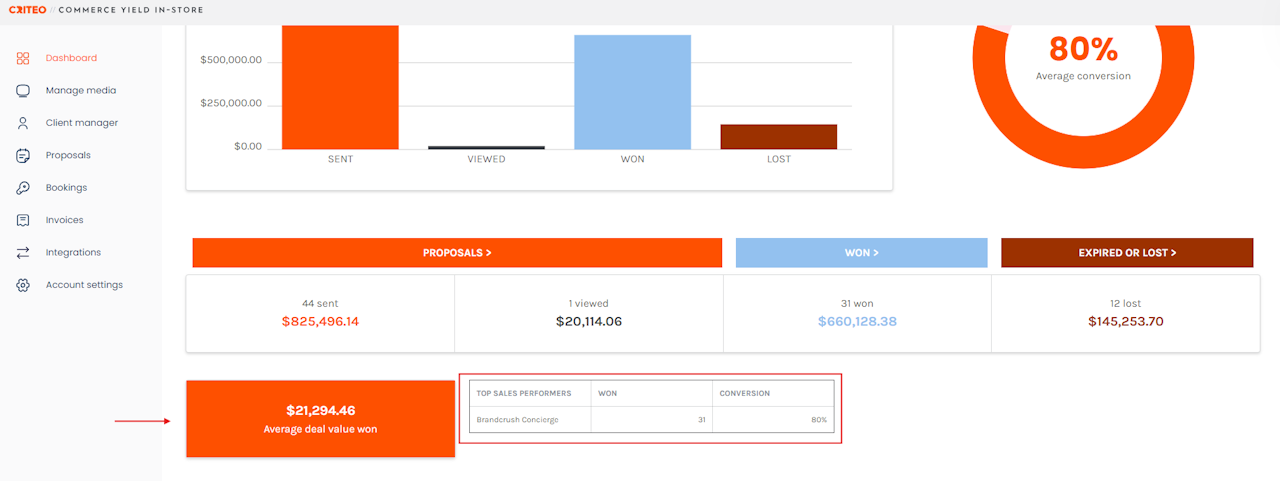
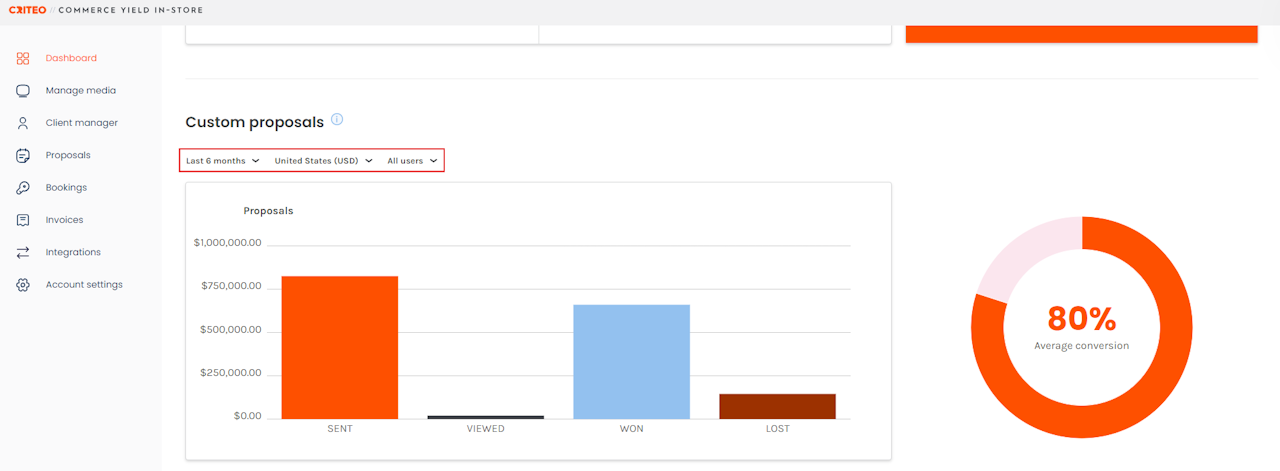
- Scroll down to view your proposal analytics, showing the number of sent, viewed, won, and lost proposals and a conversion rate — displayed as a graph and table with numerical figures.
- You can filter this data by timeframe, location, and user, like the Media sales potential section.
- Directly below these data sets is a table breakdown of sales performance by users and the average dollar amount of deals won.

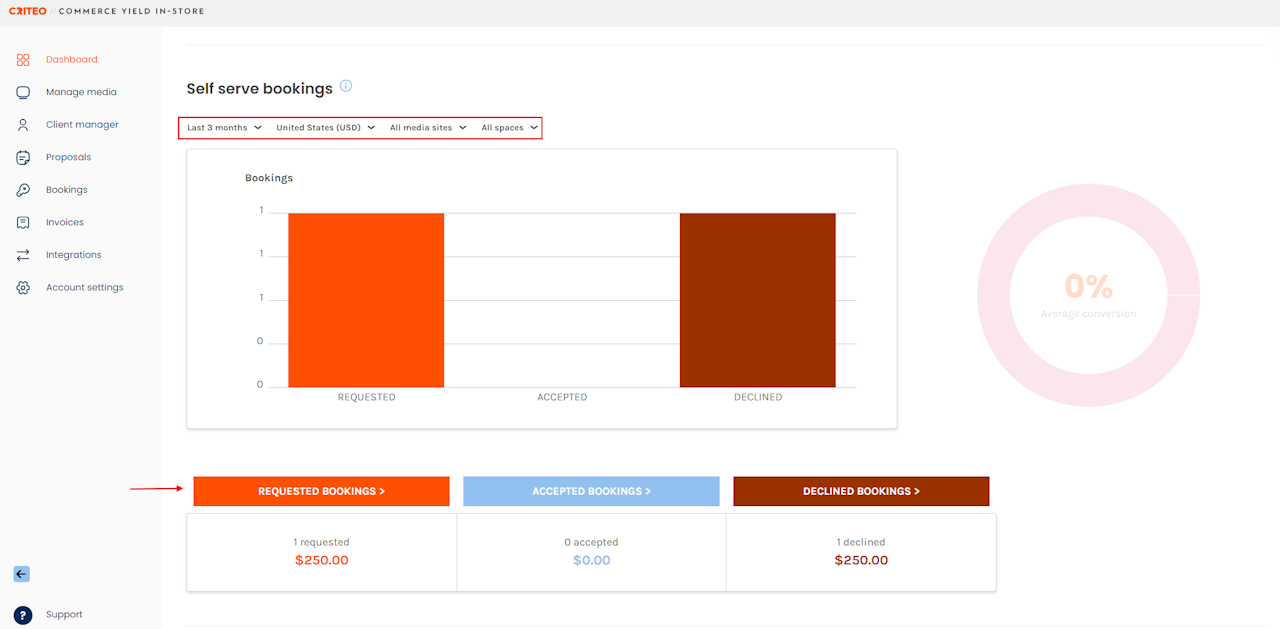
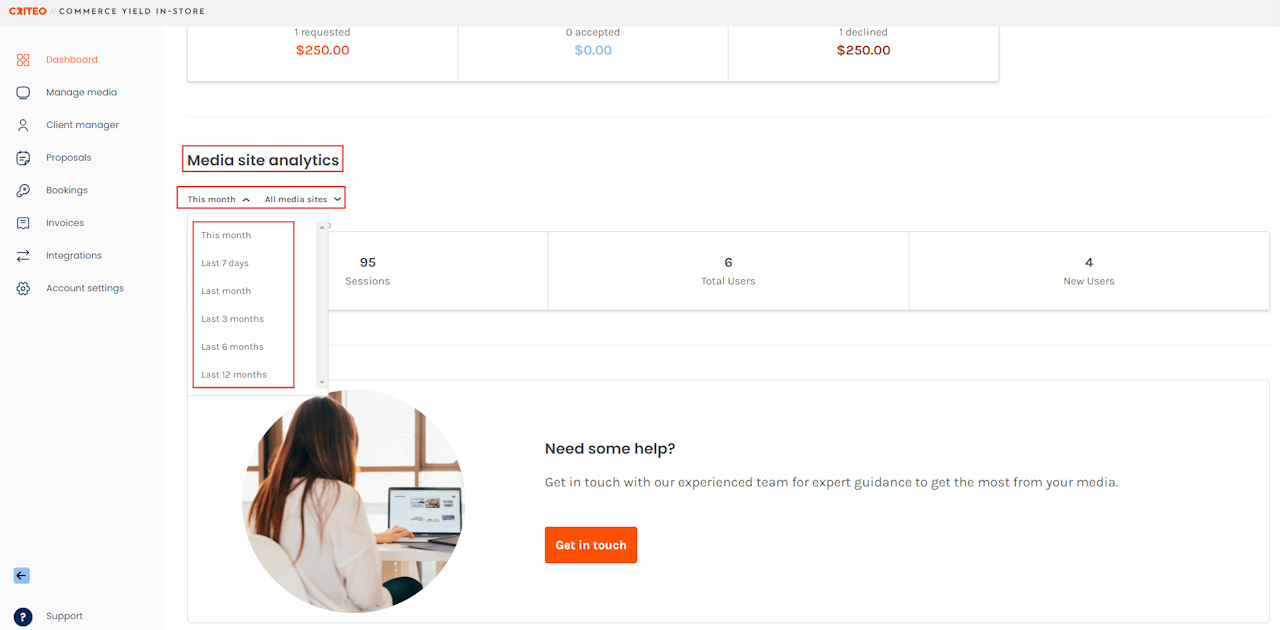
- Scroll down to view your Self serve booking analytics, providing data on all media sold via the Criteo Marketplace or your custom Media Site.
- You can filter this data set by timeframe, location, Media site and space.
- For more information on creating and organising a custom Media site, check out this step-by-step guide.

If you're still having trouble with this, please reach out to your customer service rep or contact instore.support.apac@criteo.com, and a member of our team will be in touch.

